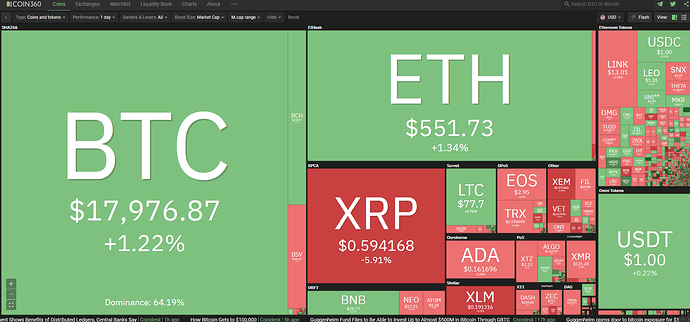
Hi everybody…
in complicated systems, doing have a strategic, top view of the system really matters.
like this:
Or what we already have here:
but not just with such quantitative data!
I think we need a page presenting all important data/services of 1hive together. so everyone can take an overall look to the hole system in one place.
It can be so stylish to be like a beehive also… with informations inside hexagons or such.
Parts of this overall system view page:
1- some of 1hive services can be represented as “Processes” which we can see their current situation (percentage of accomplishment, problems that we are dealing with, etc.)
2- Some of them may look like current price, or a chart view of honey price…
3- Some of them may look like just as a list of most active users of the week/month/year/ etc.
4- some of them may be the name of seeds/ major honey stake holders etc.
5- some of them may be the most trended concepts of week/month/year etc.
6- some of them may be some important information about infrastructure, xDai/ honeyswap Pool, liquidity, etc…
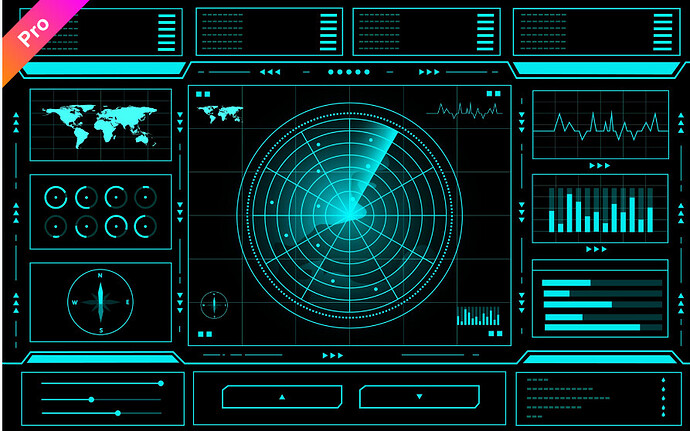
All of them may come together in one place, a cool dark design page with HUD and with a live data in it.
maybe something like a control panel which brings all important data together.
Something like these HUD cool designs:


