Hi and welcome to Gardens metrics V 1.0!
What is it ? … At the moment, it is a MVP of an app that displays, filters and interacts with the gardens data, in this case: the 1hive garden
Data ? , what data ? … Well, with Gabriel, (gabi#4807 on discord) via the quest program an idea come up, he encourage a way to collect certain type of data, so we first create a new subgraph. This way we can received and Display what we called:
Outflows: ALL! the Funding Proposals with the addresses(beneficiary), TransferAt(Dates), and requestedAmounts(Amount for each proposal) …and more
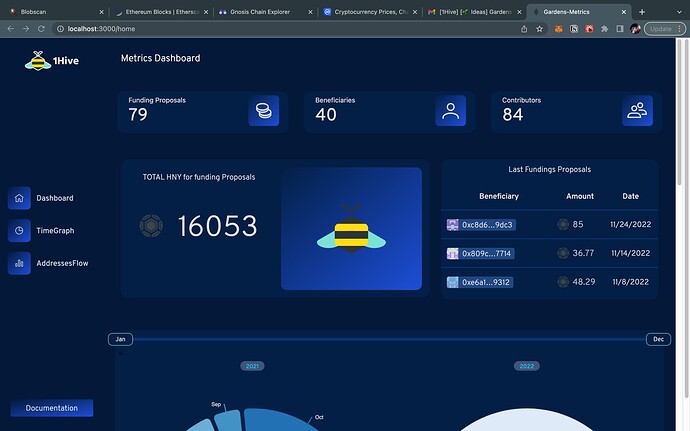
With this info I manage to create a dashboard to interact and inform. We can see at the top the total of proposals in honey, the total of benefiaries and contributors that have been so far for 1hive. Then there is the total amount of HNY used for all those funding proposals and the latest 3 fundings with its own total and date.
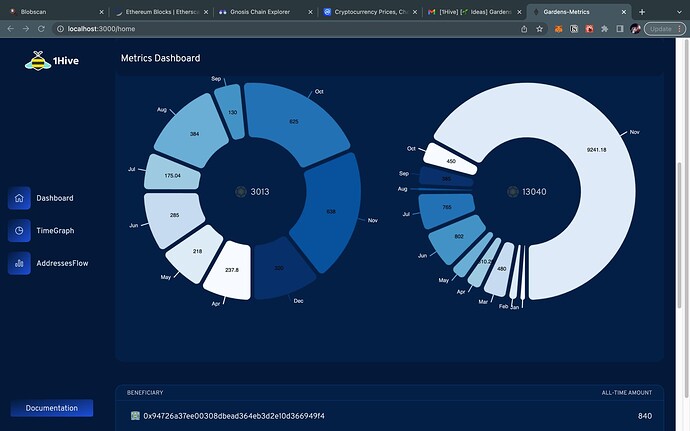
Secondly, there is a slider to interact with, it filters and shows the total amount of honey per month and per year, 2021 and 2022, with the total amount of HNY shown in the middle for the selected filter
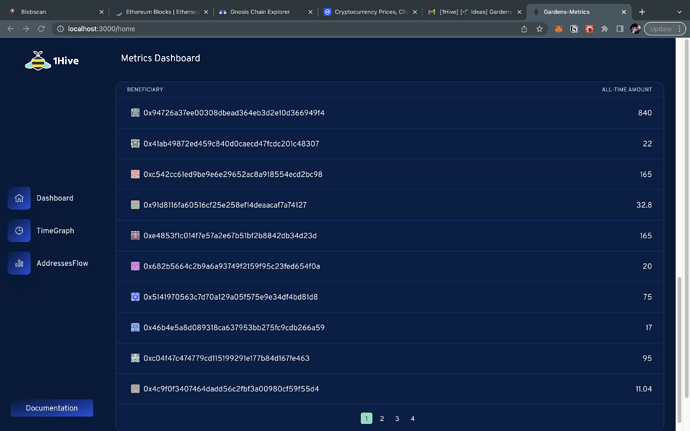
Finally and to sum up, there is and all-time-amout of HNY for every beneficary(addresses) of all funding proposals so far in 1hive
I would like to receive feedback and if possible to continue the proyect with the community, because this is just a version 1.0, I have more ideas, details to be polish and also, I think it can scale and be much informative, interactive and useful for anyone.
Technologies we used:
{ subgraphs: subgraph/1hive/garden-metrics-xdai ,
nivo ,
remix ,
tailwind ,
1hive UI ,
… }
Find all the info in following Repos:
Thanks for reading and hope the hear from you guys! ,
Mati (Mati0x#7906 on discord)


