Analysis (Correlation on Liquidity KPI update)

USDC-ETH Tx Amount and Frequency

A group of use were brainstorming ideas around trying to determine how much we should incentivize certain liquidity pairs and who we should be targeting. We want these to be data driven decisions. There are a lot of topics that can branch from the idea of what data, there are a lot of ways to look at this. We can use this type of information to target a majority with as little effort as possible to maximize on the ROI of incentives such as farming/airdropping/faucet etc.

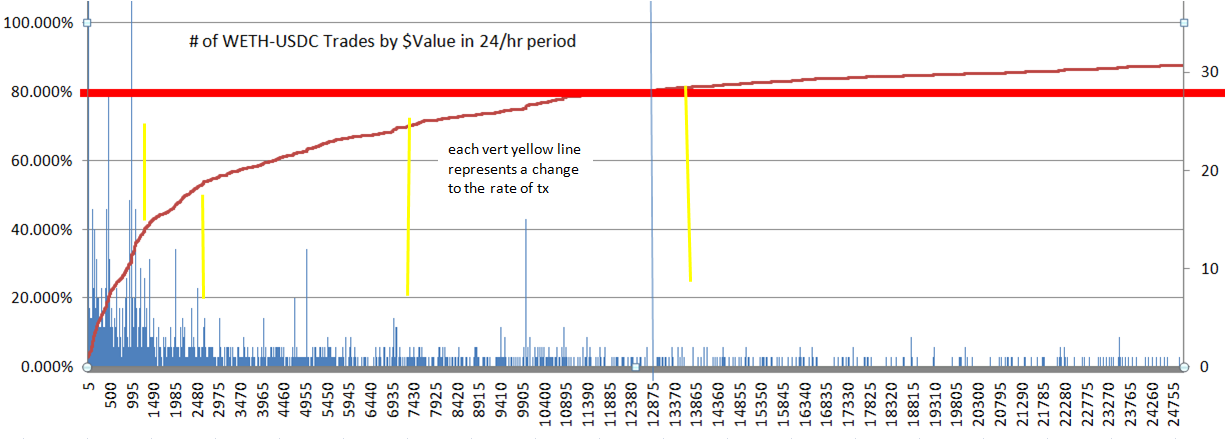
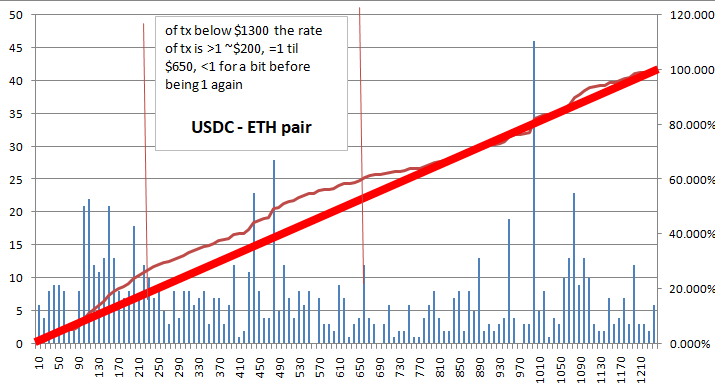
The first graph shows all the transactions for the USDC-ETH pair for ~1day (5000tx). I included yellow lines were the slope had a noticeable change. After doing so I zoomed in on the first two stages that make up about 40% of the volume (these are tx valued below ~$1,300)

The second graph is looking at all the tx between 0-$1,300. The rate is almost liner except for tx below $200 and then a slow down period between $550-$800.

More to come but I just wanted to get this out in the open for others to consider what other data can we analyze and how can we use it to make calculated decisions.

Some References:

Microtrader Cost Analysis

I ran some numbers to compare Honeyswap to Uniswap with some assumptions.

Based on the scenario above I think we want to target Round Trip Traders (RTT) to be between 0-$1,300 with the strongest emphasis on trades below $400.

If we assume RTT slippage is 0.2% on a $1,000 RTT for HNY and 0.02% on UNI (assuming $2 RT mainnet fee) we can offer better trades at less than $750 RT.

I am also assuming we need $100M-$200M in liquidity for this to occur. This amount of liquidity would result in approximately 35 tokens with >$1M in liquidity. We need >$1M in liquidity to achieve a 0.2% slippage on a $1,000 trade.`

Trades become exponentially better on Honeyswap compared to Uniswap as you approach $0 trade sizes.

I did not take into consideration of going between mainnet and xdainet because why do you need to do that? :smile:

Additional findings:

  • The absolute best fees rate for a UNI RTT in this model is $2,500 with 0.78% total fees
  • The absolute best fees rate for a HNY RTT in this model is $85 with 0.669% Total fees

Edited:
updated graph to use 0.3% fees. I was mistakenly using 0.03%, results didn’t change it just shifted everything up on the y-axis.

More References:
Issuance Policy of other Projects
2nd Round Support for Farm Proposal
Pollen & Cred distribution of HNY
Budget & Issuance

3 Likes

Correlation on UNI & HNY Liquidity KPI

The following variables were correlated:

  • UNI & HNY Price
  • UNI & HNY 24hr volume
  • UNI & HNY Vol Vs Liquidity
  • UNI & HNY Liquidity
  • UNI & HNY Farm Rewards
  • UNI & HNY # of Farms
  • BTC Price
  • ETH Price

The purpose I had in mind for using this was to determine how to drive liquidity, can we get a better understanding of some potential key levers. The goal being, we need $150M total liquidity.

I plan to re-run this correlation once a few of these farms expire, when I do that I will edit the post with updated results as the results appear to be inconclusive. I wanted to share anyway but our limited farming scenarios on Uniswap and Honeyswap don’t provide us enough data points.

image
image
image
image
image

2 Likes

Interesting. We definitely want to be careful of small sample size bias (as you say, we need more data to start having confidence in this analysis). Also wary of correlation, always :sweat: 
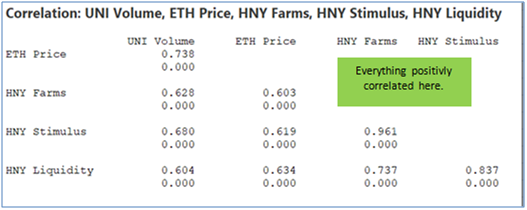
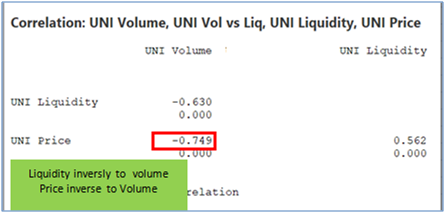
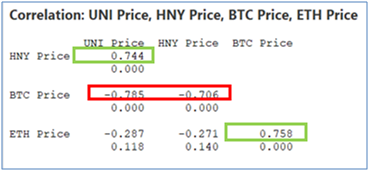
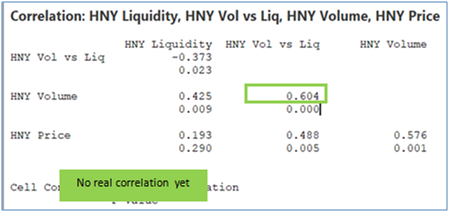
When you say positively correlated, do you mean by a statistically significant amount? Also, the entire crypto market tends to be highly correlated, so not sure if, for example, correlation between UNI and HNY is meaningful. But, also not a statistician. Curious if you have narratives/hypothesis yet that you’re looking to test as more data comes in.

Unfortunately Given the limited data I don’t yet have a hypothesis. I am mostly looking at # of farms vs rewards provided vs impact to liquidity. I ran all of these variables to check to ensure I didn’t overlook anything.

How Much HNY should we allocate to farming?

Assumptions

  • This is assuming we need $150M total liquidity on Honeyswap.
  • Also, we need to target a min of $1M liquidity on pairs.

Findings:

  • Non-HNY pairs provide best ROI for liquidity (limited data here)
  • We need more data on impact of lowering total farm rewards but 600HNY is showing a better ROI than 720 for the specific pairs
  • The data is still very scarce we need more data to make a truly educated guess. But I believe we have enough to make a reasonable proposal
  • Obviously market cycles impact all these calculations so until we have more data we have to consider that while looking at this.

Proposal

  • We should keep max HNY farm rewards below 300HNY
    • This assumes we keep cred and faucet the same and
    • Based on my previous calculation
  • For HNY pairs rewards should be max 90HNY
  • For non-HNY pairs rewards should be max 75HNY

Graphs

Graph 1

  • for hny pairs as rewards increase there is a significant decrease on your ROI above 100HNY
  • for non-hny pairs ROI appears to be linear up to 160HNY but if we only need $1M in liquidity we don’t need to provide that much

Graph 2

  • More total HNY going to farms made liquidity worse
  • Will less HNY help? How much less before reducing HNY begins to negatively impact liquidity.

Graph 3

  • confidence band tightens above 100HNY and then begins to widen above 160HNY, we need a few more data points between 50-100 and ideally more in general across the entire curve.

image
Graph 1

image
Graph 2

image
Graph 3

1 Like