USDC-ETH Tx Amount and Frequency
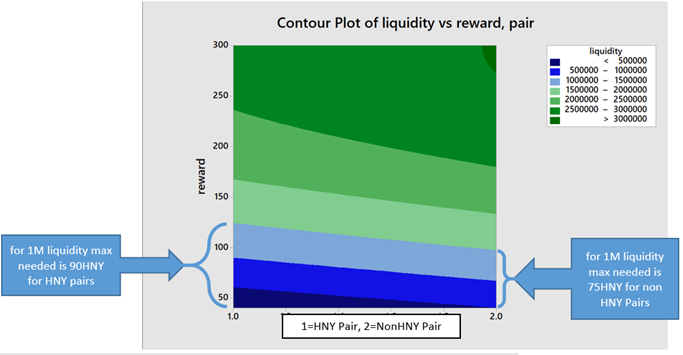
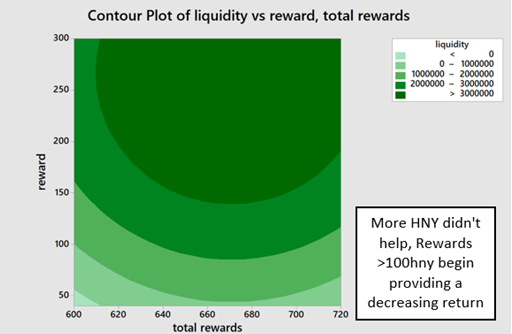
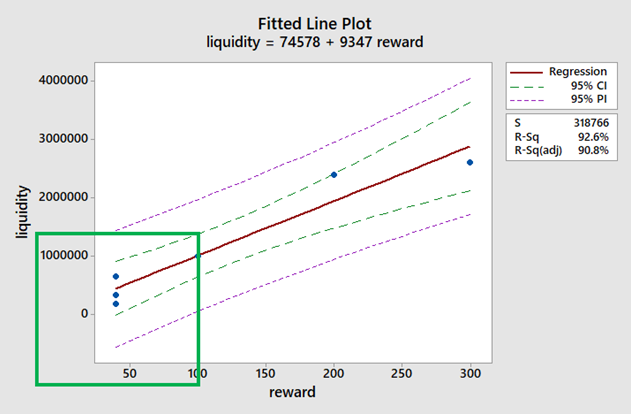
A group of use were brainstorming ideas around trying to determine how much we should incentivize certain liquidity pairs and who we should be targeting. We want these to be data driven decisions. There are a lot of topics that can branch from the idea of what data, there are a lot of ways to look at this. We can use this type of information to target a majority with as little effort as possible to maximize on the ROI of incentives such as farming/airdropping/faucet etc.
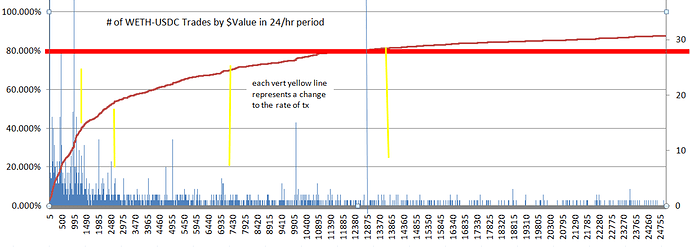
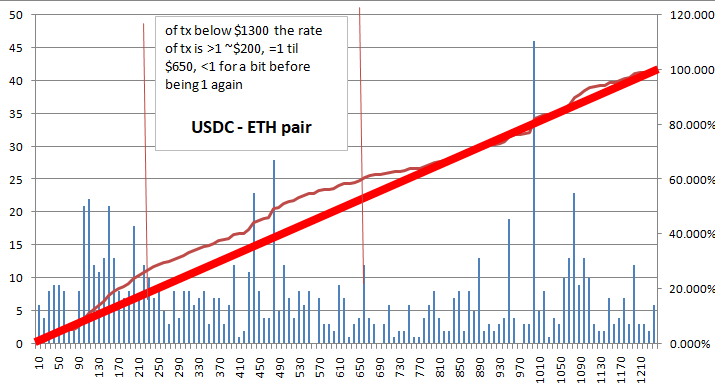
The first graph shows all the transactions for the USDC-ETH pair for ~1day (5000tx). I included yellow lines were the slope had a noticeable change. After doing so I zoomed in on the first two stages that make up about 40% of the volume (these are tx valued below ~$1,300)
The second graph is looking at all the tx between 0-$1,300. The rate is almost liner except for tx below $200 and then a slow down period between $550-$800.
More to come but I just wanted to get this out in the open for others to consider what other data can we analyze and how can we use it to make calculated decisions.


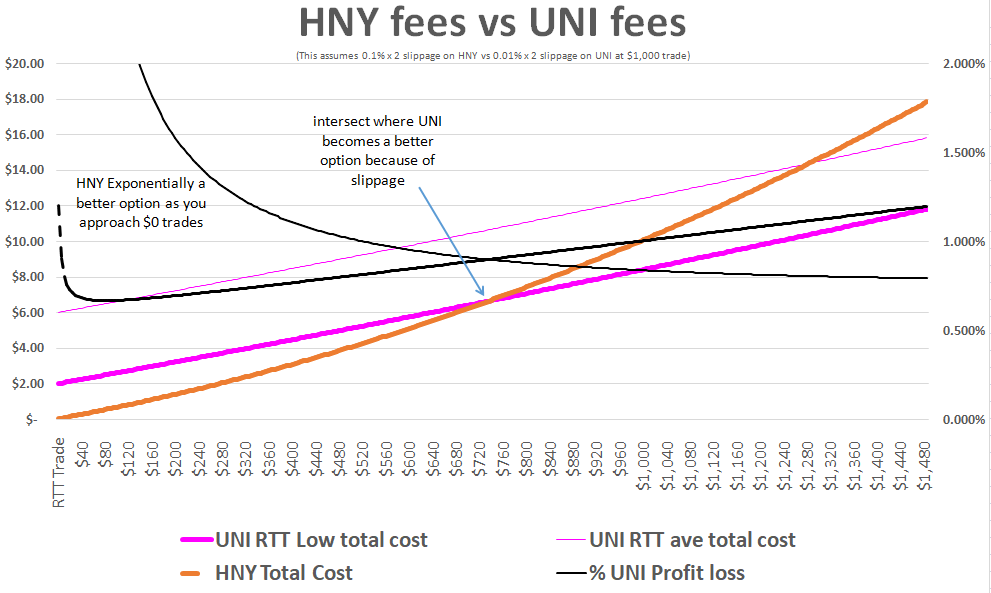
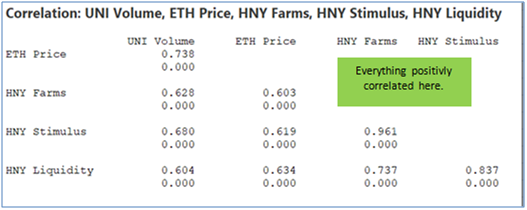
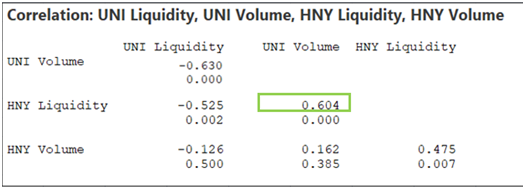
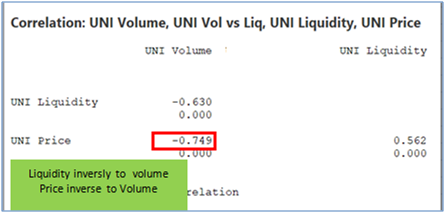
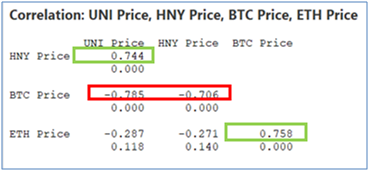
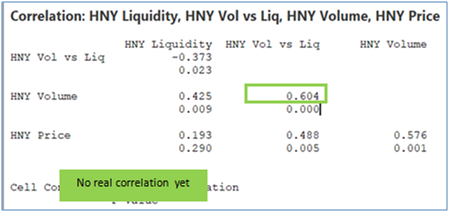
 When you say positively correlated, do you mean by a statistically significant amount? Also, the entire crypto market tends to be highly correlated, so not sure if, for example, correlation between UNI and HNY is meaningful. But, also not a statistician. Curious if you have narratives/hypothesis yet that you’re looking to test as more data comes in.